Central de Inteligência (TerraLogs)
Front-end for TerraLogs' data intelligence platform — interactive maps and analytics over rural property data.
A geospatial data intelligence platform: it turns large datasets of rural properties into an interactive map with geographic layers, property indicators, and analytics. I owned the front-end — a Google Maps experience with multiple data layers and heavy GeoJSON work, plus the dashboards around it in Vue 3 and Quasar. Backend and integrations were built by other team members.
ROLE
Front-End Engineer
Vue / Quasar
TOOLS
Vue 3
Quasar
Pinia
TanStack Query
Google Maps API
GeoJSON
ECharts
TypeScript
DURATION
2025 - Present
INTEGRATIONS
Google Maps
OpenAPI REST backend
✶ Layered interactive map
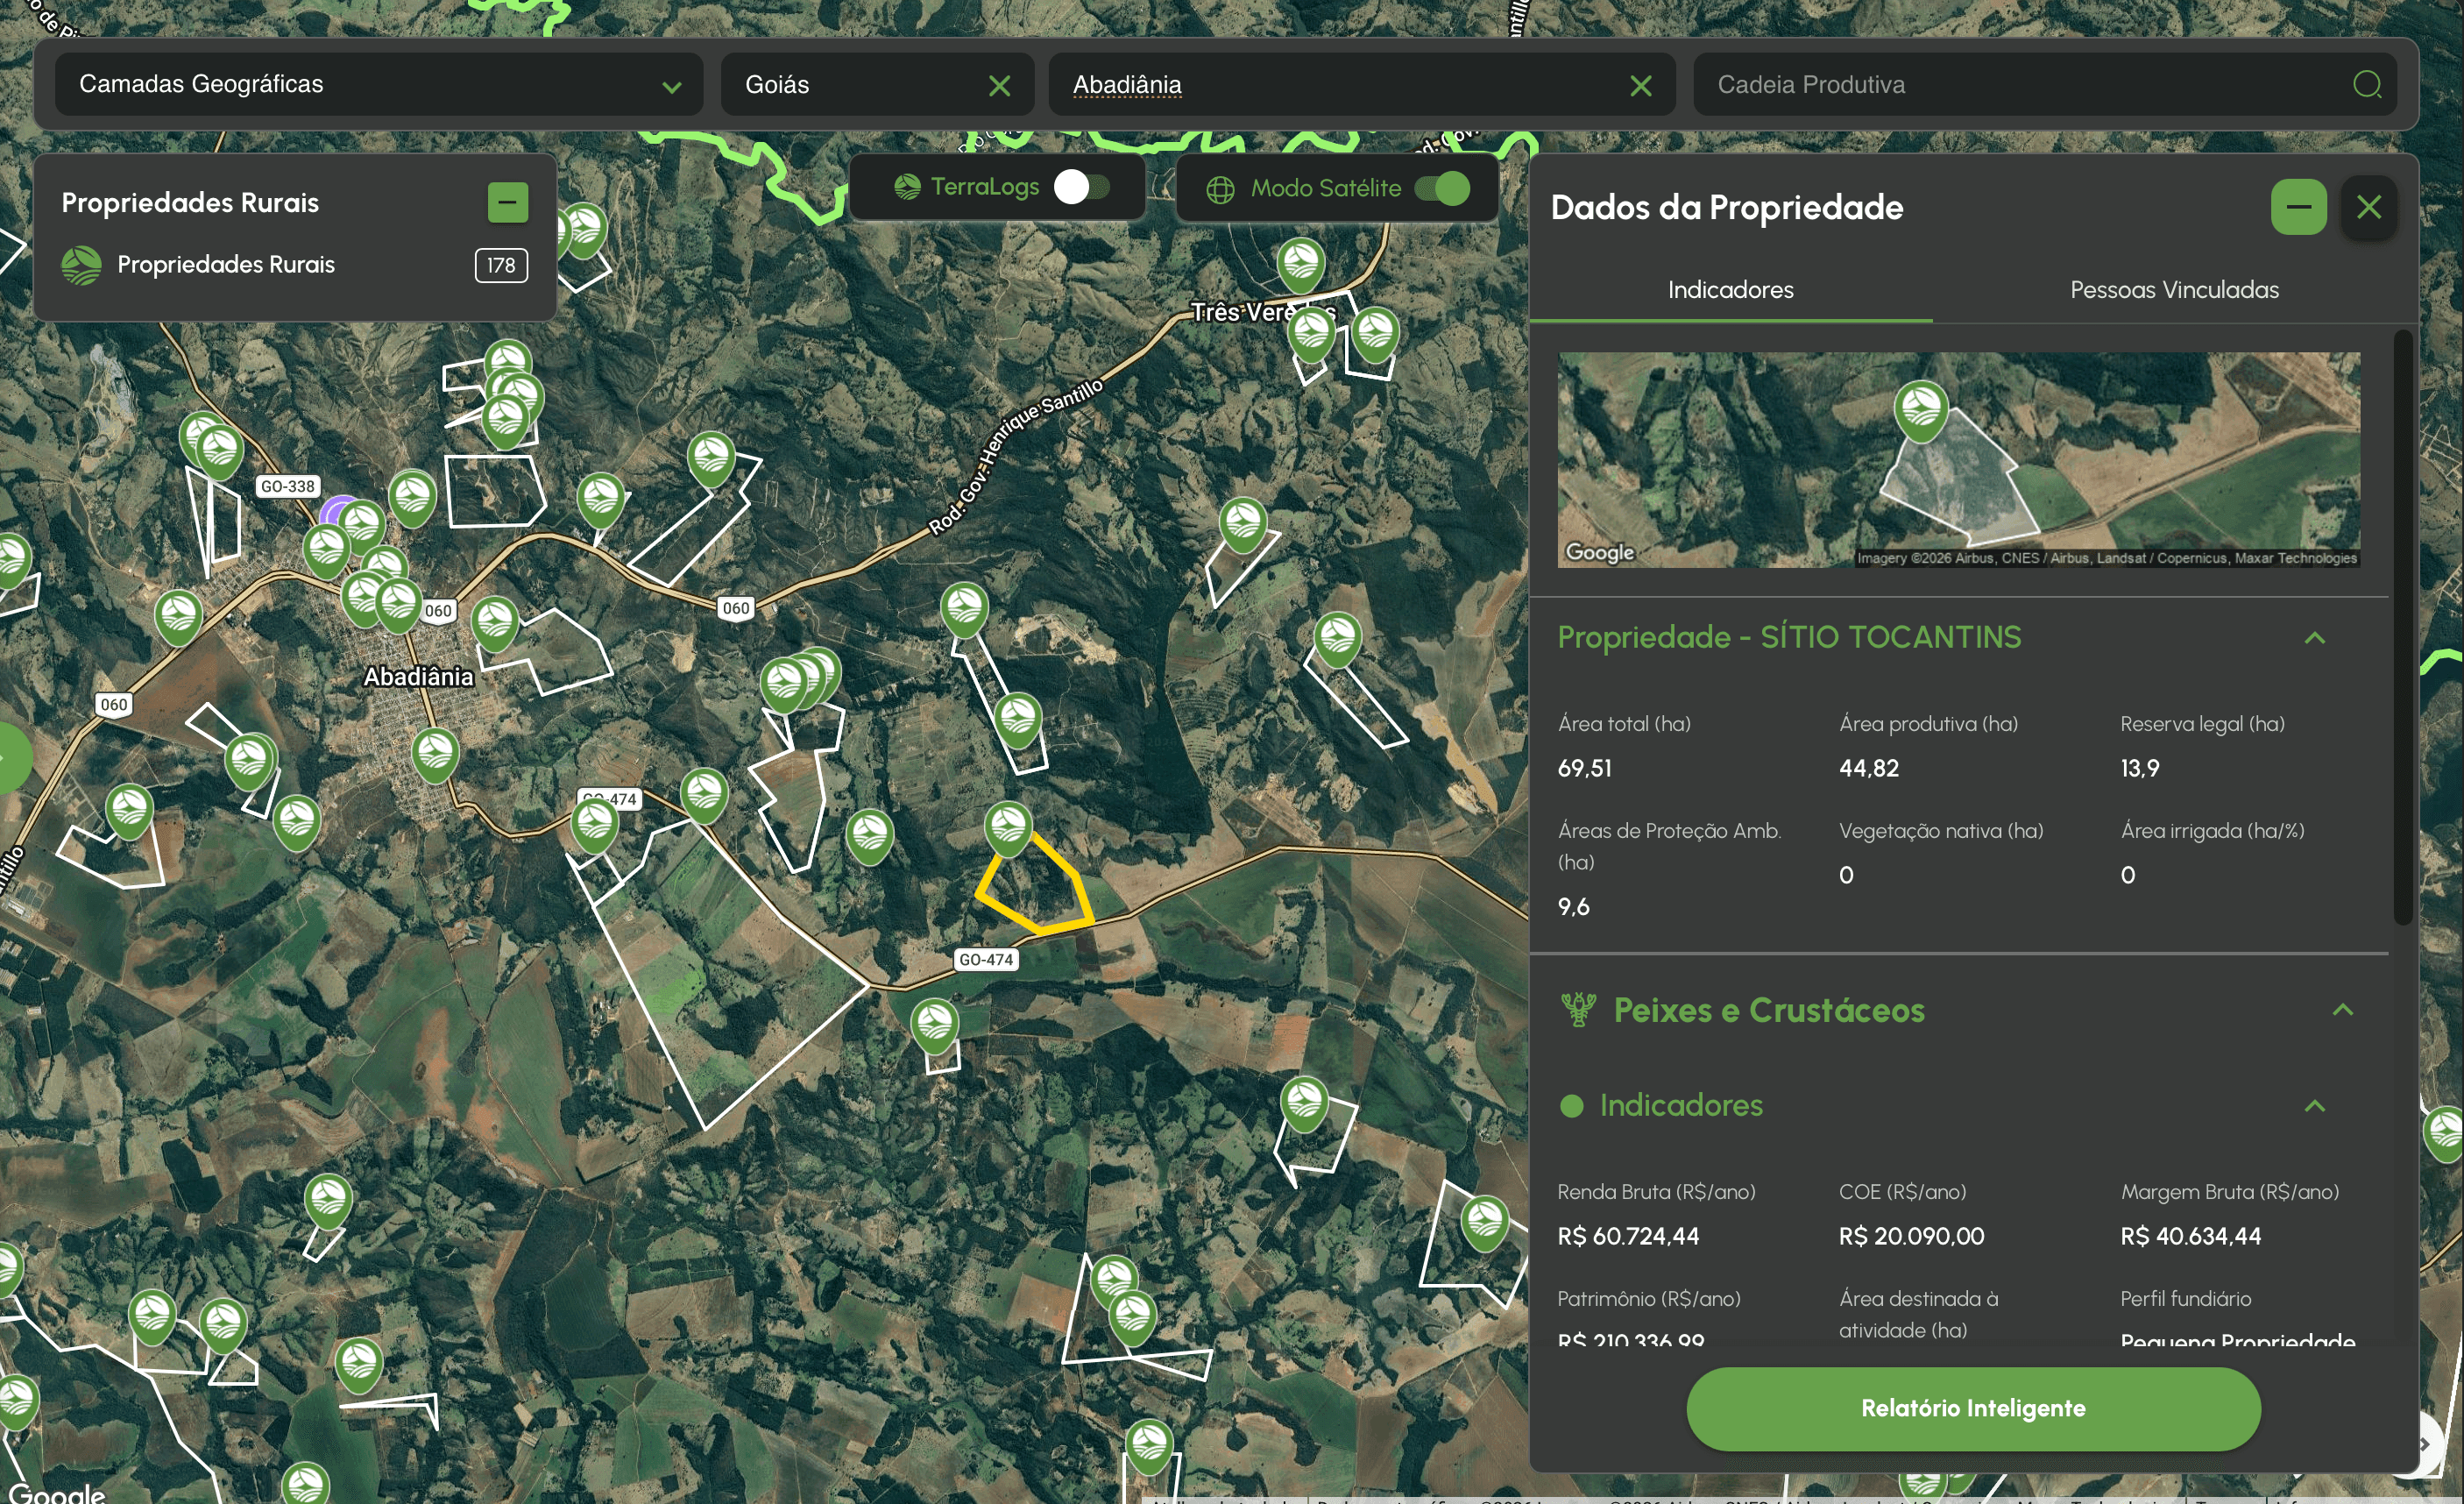
The core: rural property boundaries, geographic layers, and overlays rendered on Google Maps as toggleable layers with per-layer styling, kept in sync as the user pans and zooms across satellite and map views.
✶ GeoJSON manipulation
Most of the complexity — parsing, transforming, and rendering large GeoJSON feature collections, with styling and filtering driven by feature properties.
✶ Property data & indicators
Selecting a property surfaces its data panel — area, production, and financial indicators — with feature selection, hover states, and info windows tuned to stay responsive with many features on screen.
✶ Analytics dashboards
ECharts dashboards bound to TanStack Query, with Pinia sharing selections and filters across map and dashboards.